SysMon configuration file ‘hostname’.smon
General information about Sysmon configuration file
- The System Monitor (SysMon) configuration file MUST reside in “$SADMIN/cfg” directory and MUST be name “$(hostname -s).smon”. Don’t worry SADMIN setup script have all done that for you. Blank line and line that start with a “#” (comment) are ignored.
- The configuration is loaded in memory when the SADMIN System Monitor start.
- If new filesystem are detected by SysMon they are added automatically to this file.
- Sysmon is run every 5 minutes from the sadm_server crontab.
- Each lines in the SysMon configuration file is evaluated and process one by one.
- After evaluating a line, the result is recorded in column 2.
- Before exiting SysMon write the updated version of the Sysmon configuration file.
- Each time the system monitor run, the last line of the configuration file is updated. We can see
the System Monitor version number, the server name, the last boot date, the current date and finally
the time it took to process all the requested tests.
#SYSMON 2.43 holmes, Boot 2021-05-28 07:16:27, Sat Jun 12 10:47:03 2021, Run 1.00 sec - Before the System Monitor exit, it write what we call a report file, which contain any error or
warning detected while processing each line. This SysMon report file is named “$(hostname -s).rpt”
and it’s created in the “$SADMIN/dat/rpt” directory. This file will then get transferred to the SADMIN
server by the sadm_fetch_clients.sh for analysis and
trigger an alert if needed.
# cat $SADMIN/dat/rpt/holmes.rpt
Warning;holmes;2021.06.29;10:47;linux;FILESYSTEM;Filesystem /wsadmin at 82% >= 80%;default;default
Format of the Sysmon configuration file
- Comments lines must always begin with a “#” (Column 1)
- Column are delimited by space(s) and/or tabulation.
- Updated value (or resulting status) is recorded in the second column of each line
- At execution each line is evaluated based on the test requested in the first column
- Column 1 dictate the kind of test that will performed on that line.
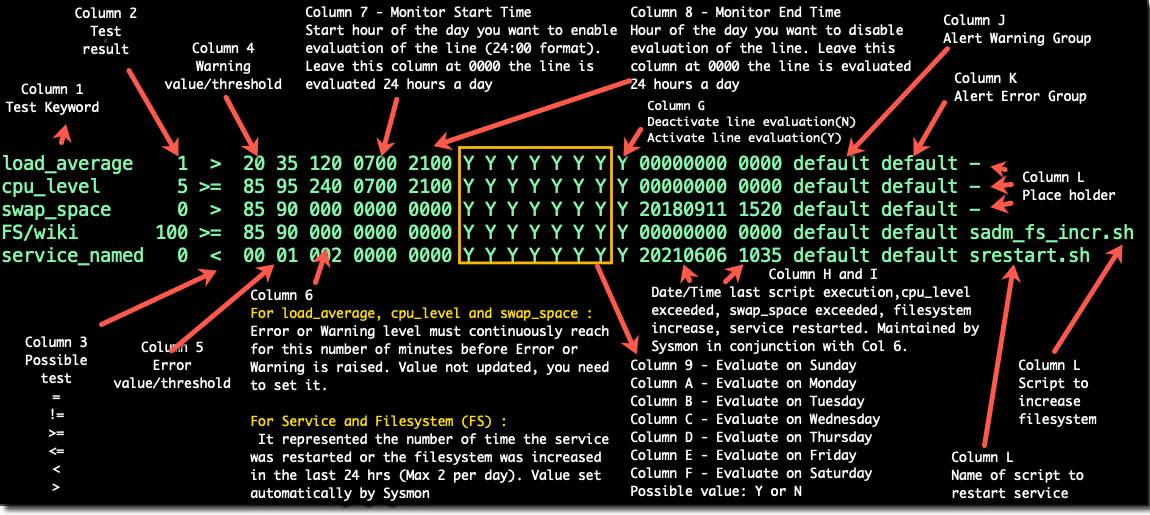
Here is a diagram that explain each column of the Sysmon configuration file
Conditions for a line to be evaluated
You may not want to perform a test every time the system monitor run. For example, you may not want
to test the CPU utilization on the weekend, because you know you will be running some batch job and
it will take more CPU and this is normal. Or just disable it on Saturday between 1am and 7am, this
is the kind of conditions we will take a look below.
Before a line is evaluated it must meet certain conditions specified by certain column on that same
line. All the conditions below must be met before a line is evaluated.
- Line Active or Inactive (Column G)
When this column is set to ‘Y’ (Active), then the line met the first condition to get evaluated (Default). If set to ‘N’ (Inactive), the line is not evaluated and SysMon continue with the next line in SysMon config file. This column can be use to temporarily deactivate a line.
- Monitor Start Time (Column 7) and End Time (Column 8)
These two columns represent the start time and end time for a line to be evaluated. If one of these two columns is zero then the line met the second condition to get evaluated. The start time column (7) represent the hour of the day you want to start evaluation of the line (In 24:00 format), the end time in column (8), is the hour of the day you want to disable evaluation of the line. For example, let’s say you only want to evaluate a line only between 7am and 9pm, you would put ‘0700’ (Monitor Start Time) in column 7 and ‘2100’ in column 8 (Monitor End Time).
- Particular day to evaluate (Column 9 to F)
Each of these columns represent a day of the week. Column 9 represent Sunday, ‘A’ Monday, ‘B’ Tuesday, ‘C’ Wednesday, ‘D’ Thursday, ‘E’ Friday and finally ‘F’ Saturday. By default, all of these columns contain a ‘Y’ meaning that the line is evaluated every day of the week. For example, if you want to disable line evaluation on Saturday and Sunday, you would put ‘N’ in column ‘9’ and ‘F’.
- Last event date (Col H) & time (Col I) vs Minimum duration/Run Counter (Col 6)
-
When Sysmon monitor the CPU usage level for example, you don’t want to be alerted every time the CPU reach the warning or error level. For example, you want to be alerted, if the CPU utilization is above the ‘Error’ level for more than 30 minutes. This is when column 6 come in handy, you specify in column 6 the continuous number of minutes the CPU must exceed the warning or error level, before being alerted. For example if you put ‘060’ in column 6 then the alert would be generated only when the CPU usage exceed the warning or error level for more than 60 minutes. To be able to do that, Sysmon need know when was the date and time of the first alert, this is recorded in column ‘H’ and ‘I’. Every time the CPU level is under the warning and error level, column ‘H’ and ‘I’ are set back to zero. The same logic apply to ‘Load average’ and the ‘Swap Space’.
-
For Service (service_), custom script execution and filesystem (FS) lines, column 6 represent the number of time the service was restarted or the filesystem increased was attempted in the last 24 Hours. You don’t need to change this field, it’s taken care of automatically (Unless you want to reset it to 0 and provoke a service restart or a filesystem increase within the 24 hrs). Every time a service is restarted column 6 is increase by one. Service can’t be restarted automatically more than 2 times every 24 hours, same thing for the filesystem increase, only two filesystems increase per 24 hours can be done (each 10% increase). Again when the service is restarted, or fileystem get lower than warning and error level then col 6, column ‘H’ and ‘I get reset to 0. To be able to do that, Sysmon need know when was the date and time of the first alert, this is recorded in column ‘H’ and ‘I’.
-
service_cron,crond 1 < 00 01 000 0000 0000 Y Y Y Y Y Y Y Y 20180820 1520 default default srestart.sh
service_postfix    1 < 00 01 000 0000 0000 Y Y Y Y Y Y Y Y 20180820 1520 default default
Warning alert group
Column ‘J’ represent the Warning Alert Group to advise when a warning need to be issue. Group MUST be defined in the Alert Group File ($SADMIN/cfg/alert_group.cfg). When new filesystem line are added the default group used for Warning/Error is the one defined sadmin configuration file ($SADMIN/cfg/sadmin.cfg).
Error alert group
Column ‘K’ represent the Error Alert Group to advise when a error need to be issue. Group MUST be defined in the Alert Group File ($SADMIN/cfg/alert_group.cfg). When new filesystem line are added the default group used for Warning/Error is the one defined sadmin configuration file ($SADMIN/cfg/sadmin.cfg).
Monitoring modules available
- Monitoring the system load average.
- Monitoring the CPU utilization.
- Monitoring system swap space.
- Verifying Web site responsiveness.
- Monitoring Services.
- Verifying if a daemon (process) is running.
- Filesystem monitoring.
- Monitoring Multipath.
- Monitor the ping response to a system.
- Running script within SysMon.
See also
| Link to … | Description |
|---|---|
| sadm_sysmon_tui.pl | Command line summary of alerts and failed scripts of all your servers. |
| sadm_sysmon.pl | Client system monitor |
| sadm_fetch_clients.sh | rsync all .rch/.log/.rpt from actives clients to the SADMIN server |
| SysMon configuration file | Client System Monitor configuration file |
| sadmin.cfg | SADMIN main configuration file |